Choosing a monitoring tool is no easy task. It is probably going to involve many areas that may have to change the way they work, how they view information and even how they communicate. That is why it is especially important to be clear about how the tool you are going to choose works internally.

At WOCU we have set out to be as transparent as possible so that anyone interested in learning about our solution knows how we work.
But first let's start with some basic concepts.
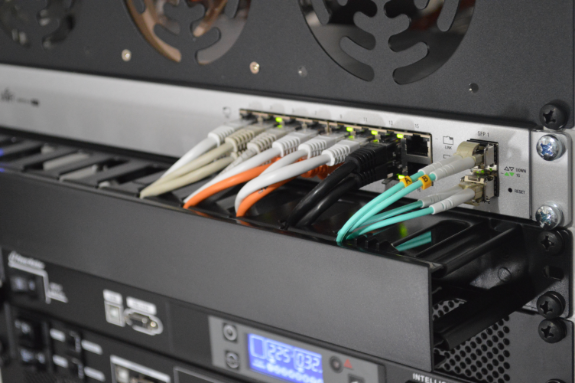
In our case, the most common monitoring we carry out with WOCU is the monitoring of network equipment interfaces via SNMP.
What are the things we take into account?
Network interface metrics
Network performance is driven by a few key factors: bandwidth, throughput, latency, errors and jitter.
This is what we mean when we use the following terms:
1.- Ancho de Banda
Ancho de Banda es la cantidad máxima teórica de información que puede enviarse a través de una conexión. Normalmente se expresa en bits por segundo, usualmente en Megabits por segundo (Mbps) o Gigabits por segundo (Gbps) - no confundir con Megabytes por segundo (Mbps) o Gigabytes por segundo (Gbps).
Es fácil convertir bps a Bps dividiendo el número por ocho, o por Bps a bps multiplicando por ocho.
2.- Efficiency
The Throughput is the number of messages that were successfully received, per unit of time, also expressed in bits per second. Because of the overhead of the transport protocols used, the throughput will always be less than the bandwidth of the link.
For example, take a standard Ethernet link with an MTU of 1500 bytes. The maximum utilization of a TCP flow is limited to 95% of the bandwidth due to the overhead of the Ethernet, IP and TCP encapsulations. The more encapsulation you add (e.g. MPLS) the less efficient you will be. If you only reach 60%, there is probably a problem ...
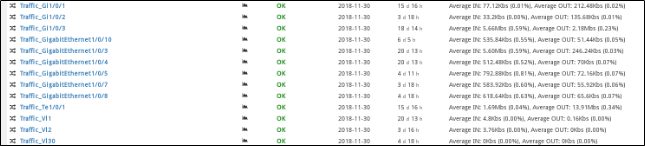
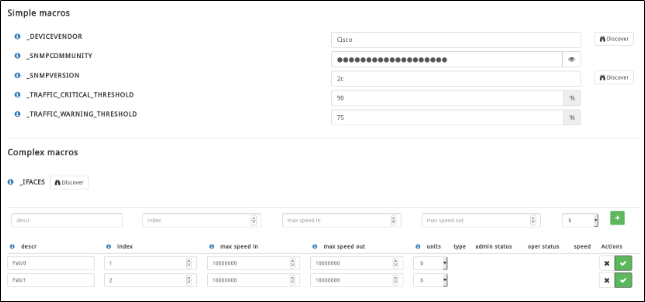
Monitoring the performance of a link is important to make sure you are getting the most out of it. What we do in WOCU is collect the octets via IF-MIB and compare them to the speed of that link. This gives us the throughput at that particular point in time.
If you suspect that you should have higher throughput than you do, you can check for errors: dropouts and saturation can indicate an overloaded network link, while collisions indicate link speed misconfiguration. Of course, physical problems can also impact performance, so make sure you're monitoring that as well.
So, to monitor performance, we use SNMP counters, since by using this method, the counter itself already takes into account any overhead.
3.-Latency
Latency is the time it takes for a packet to make its way across a network link. The lower the better, of course, but we have to take into account the physical limitations of the speed at which electricity (or light in the case of optimal fiber cables) can travel.
Latency can have a big impact on the user experience in some applications that are not tolerant to high latency rates.
4.- Errors
Errors include metrics such as Rx/Tx errors, discards, CRC errors, saturation, carrier errors, resets and collisions. It is best to consult the documentation of each network device to see how these metrics are exposed (some manufacturers do not provide them).
Normally the Rx/Tx errors are exposed in the IF-MIB table, but depending on the agent implementation, it may or may not include other error metrics. Most commonly, Rx/Tx errors are an aggregation of error metrics and therefore are not entirely reliable for determining what is going wrong. The more specific error counters are much more useful for diagnosing and alerting about problems in the network.
What is most commonly monitored are physical problems: electrical interference and bad cables or transceivers that can degrade network performance quickly. You can see this by monitoring CRC and carrier errors, and if it is a fiber connection, you will have to take into account light levels..
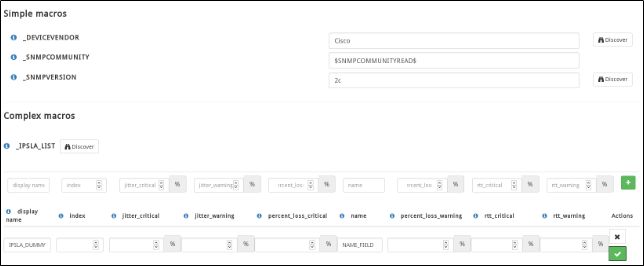
5.- Jitter
Jitter is the deviation of a metric from its normal measurement. In networking, jitter is usually applied to latency measurements. For example, if the latency goes from 1ms to 150ms to 30ms, this would be an example of high jitter, while a continuous latency of 3ms would have no jitter. Jitter is important especially in voice and audio infrastructures, as it makes the streams passing through look and sound jittery. You can pay attention to jitter latency if you monitor latency and observe inconsistencies.
In summary, a good way to explain the relationship between these metrics would be as follows:
- Imagine a 4-lane highway. This would be the bandwidth.
If we increase the number of lanes the bandwidth increases, but it does not have to increase the throughput (there may be an accident on the highway).
- Latency would be the length of the road. No matter how much bandwidth you have, you will still have to drive the same distance to traverse it.
- Throughput would be the number of vehicles that can travel the highway in a given time.
- Errors would be anything from a car accident, to someone stopping traffic unexpectedly causing a traffic jam.

If the road is always full, if it takes a long time to get from point A to point B or if there are errors (delays, accidents), you can try to solve this by adding another lane, but there is a clear limitation: you can only make the road as big as the space you have, not to mention the cost.
Sometimes there are no errors and all traffic moves naturally. In that case you have a perfect utilization :)
We hope you have become clearer about all these terms we handle when we talk about monitoring the health of a network.