When implementing the Wazuh solution and the elements involved in the solution (Elasticsearch, Kibana, Filebeat), there are performance problems or operation of the tool, which impact directly or indirectly to the proper functioning of the same, so when this situation arises have some basic steps or basic guide to solve the problem, since through the official documentation is not exposed in detail the existing and most common problems of the solution.
Therefore, throughout this blog we will present 4 basic solutions to effectively solve problems corresponding to a bug or poor performance of the Wazuh solution.
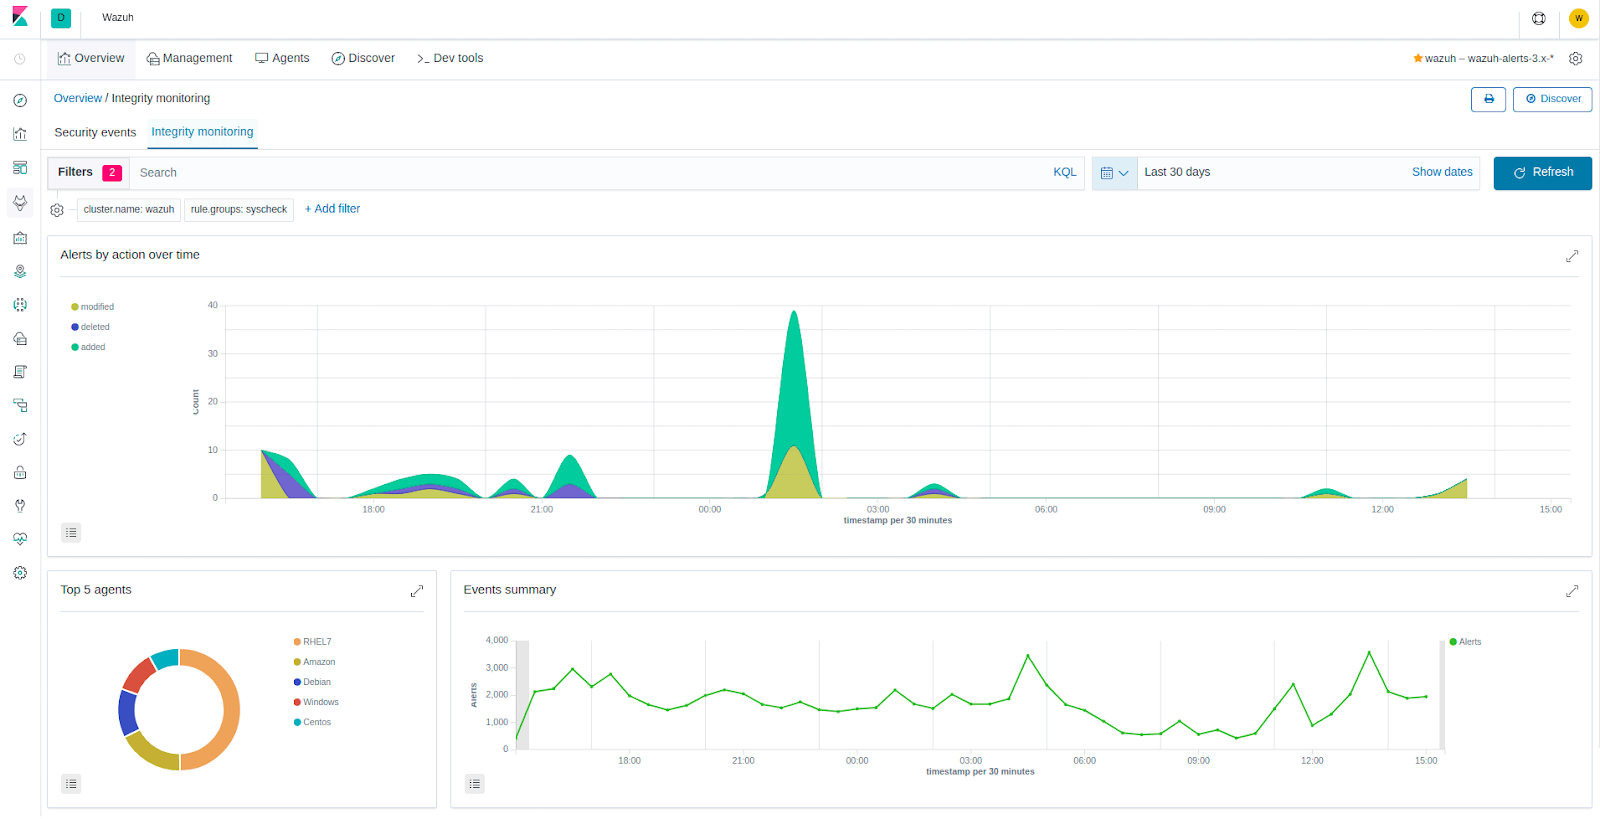
What is Wazuh?
Wazuh is an opensource platform for threat detection, security monitoring, incident response and compliance, with the ability to monitor local servers, cloud services and containers.
https://documentation.wazuh.com/3.13/index.html
Space is important
In all the implementations generated from a SIEM or an event collector, disk space is the one that in most cases becomes saturated if there is not an adequate data distribution or an architecture that allows optimizing disk space.
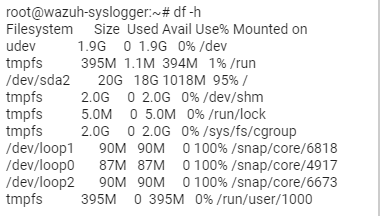
In this case the problem that generates a full disk space or in the limits of 100% of use, causes the Wazuh API to stop working and this results in loss of events, similarly the space in Elasticsearch if it reaches the limits of 100% enters a read-only mode and stops indexing events until the disk space is increased or an action is generated to remedy the disk space, so it is important to always be aware of the disk space with the command df -h, which allows us to have a view of the remaining space...
Balancing Shards and Indexes
Another of the most frequent reasons when solving problems that arise in the Wazuh solution are the generated Indexes and the shards established for each Index, so it is important to know the architecture of the solution and establish a number of Shards per Index based on the same; Assuming that you have an adequate architecture and there are problems with the indexes the first thing is to check the status of the cluster to check how serious the situation is with the following command.
curl -X GET "https://[IP perteneciente a elasticsearch]:9200/_cluster/health?pretty"
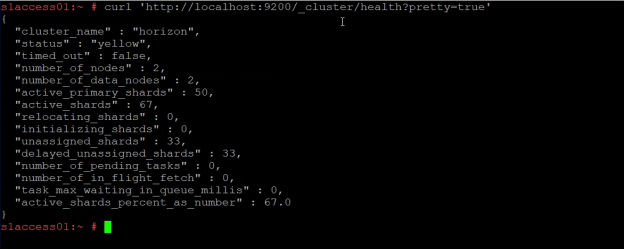
This command will give us an overview of the elasticsearch cluster status reported by 3 states: green, yellow and red.
Generally when errors occur with respect to indexes and shards the cluster status will be yellow or red.
Once this check is done the following command will be entered:
curl -X GET 'https://instance:9200/_cat/indices?v'
This allows us to identify the status of the indexes, in the same way these will be represented by green, yellow and red, in addition to showing the size in disk that occupy the indexes as well as the shards and replicas generated by index.
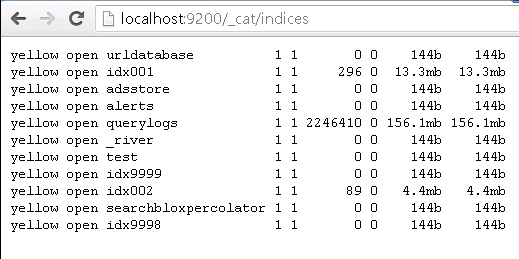
The correct status of an index must be Green which indicates that the index is correct and does not have any problem, in case of an index in yellow or red status this will indicate that the index has a problem that can be from a bad creation of the same to involve a lack of disk space, so it is recommended in these cases to close the indexes that present problems by means of the following command:
curl -X POST 'https://instance:9200//my_index/_close'
Note: When closing the indexes it is important not to close the indexes with the character (.) at the beginning of them, since it could generate problems in the cluster from the deconfiguration of the Wazuh API up to the loss of access to the solution.
Once the indexes marked Yellow and Red have been closed, it is necessary to restart the whole solution from Elasticsearch, Kibana, Filebeat to the Wazuh API and the Wazuh Manager.
In most of the cases that present errors in the state of the indexes the exposed solution will solve the problem, but once the problem is solved by this method it is highly recommended to validate a correct architecture to restructure the solution if necessary.
Review the Logs
Sometimes the problem is generated by "unknown" reasons, so in this case it is necessary to identify the paths where the logs of the solution are stored and once the path is identified, review the log in detail to determine the problem.
Below are the paths of the logs to be reviewed to determine the problem involved in the solution.
Logs to review in Wazuh:
/var/ossec/logs
https://documentation.wazuh.com/3.9/user-manual/reference/ossec-conf/logging.html
Logs to review in Filebeat:
/var/log/flibeat
https://documentation.wazuh.com/3.9/user-manual/reference/ossec-conf/logging.html
Logs to check in Elasticsearch:
/var/log/elasticsearch
https://www.elastic.co/guide/en/elasticsearch/reference/current/path-settings.html
Once the error is identified, it is necessary to search in the official documentation of each of the platforms or in the official blogs as in the case of Wazuh that through the Github has a forum to solve the Bugs detected in the solution..
https://github.com/wazuh/wazuh-kibana-app/issues
The old reliable = Restart services
Although it looks like a joke in reality this process in most cases solves the existing problems in the Wazuh solution as shown in the following link (https://github.com/wazuh/wazuh-kibana-app/issues/1016), of course this process is recommended once all the solutions raised through this blog are exhausted.
Conclusion
Throughout this blog a series of processes that have served to solve various problems in solution environments and in the end the blog is presented as a guide to help in case of unforeseen events presented in the solution, to discard efficiently and effectively any problem already in a more robust stage of any implementation through the Wazuh solution.