CAs you already know, WOCU Monitoring is a product in which we are continuously working to improve its functionalities and features.
So we would like to share with you the new features included in release 0.33 of our monitoring solution.
We have worked a lot on the stability of the solution, gaining performance in queries to the data backends in order to obtain a better user experience and support realms with a greater number of hosts.
On the other hand, important visual changes have also been made to the interface, such as the grouping of the problems tab in a single page or the visualization of performance metrics from the host or service modal itself.
And last but not least, report scheduling has been implemented, allowing the execution of reports on the date defined by the user and the notification of the results.
Here are the changes in this version:
Assets from Status
Functionality which allows to click on the global status widget of each realm and go to the assets page applying the corresponding filter. This will result in greater agility on the part of the operator to examine the devices of a given status.
More information in the WOCU User Manual.
New Metrics tab
A new tab has been added to the host modal and service modal to present the PNP metrics of a host or service.
More information can be found in the WOCU User Manual.
Unification of the Problems tab
The Problems tab in the Aggregator has been unified, now everything is displayed in a single view. In one table you have all host problems (hosts and Business Process hosts), and in another table all service problems (services and Business Process services).
More information in the WOCU User Manual.
Downloading CSV and JSON in Problems and Events
Before version 0.33, assets could be downloaded in JSON and CSV format from the Assets page. Now, we have also added the functionality to download assets from the Problems page, both hosts and services also in JSON and CSV formats.
More information can be found in the WOCU User Manual.
Centralized database for monitoring events
The increase in performance and reliability obtained by using a centralized Mongodb-based backend for the storage and management of all monitoring events has made us decide to change the default architecture for all installations.
Improvements in the internal cache for data requests
The internal cache system for data requests has been substantially improved, so that requests that use dates as arguments are also cached.
Unlimited records in Top Hosts report
An improvement has been introduced in the "Top Hosts" report allowing the user to list the entire set of records obtained in the result of the report execution. This will be of interest to you if you have realms with many devices.
More information in the WOCU User Manual.
Link to Host and Service modes in Availability reports
A link has been added to each entry in the hosts and services table of the Availability Report, which redirects the user to host or service modes respectively.
More information can be found in the WOCU User Manual.
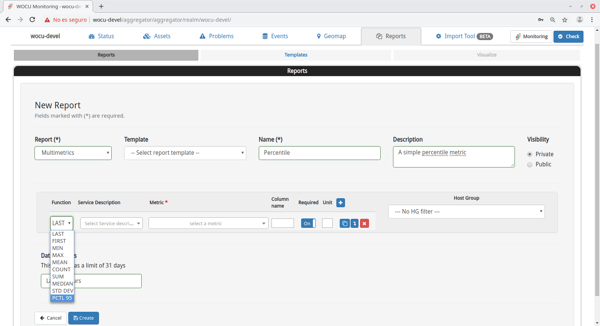
Multi-metric report: new 95th Percentile feature
The 95th percentile feature has been added to the multimetric reports. The 95th percentile function consists in obtaining the maximum value of a sample but eliminating the top 5% of the highest values, in order to obtain more normalized results by eliminating the maximum peaks of the sample. The application of the 95th percentile is a more or less widespread consensus in the industry for the calculation of bandwidth reports.
Report Scheduling
In order to automate the operation of wocu reports, the possibility of scheduling them has been added. With this new functionality, you can schedule the launching of a report on a certain date and with a certain frequency. In addition, the scheduling flexibility is very wide and can be adapted to almost any need.
In the section where the reports are listed, specifically in the actions, a button has been added to schedule that report:
Import Tool - Configuration of BP hosts in hostgroups.
A new field has been added to the hostgroups form that allows you to define which BP hosts will be part of a specific hostgroup.
More information in the WOCU User Manual.
Support for FQDN addresses in host address field
Added the possibility to use names in the configuration of the "address" field of any host, this makes it easier to monitor assets referenced by name instead of ip address.
More information in the WOCU User Manual.
Import Tool - New configuration field in CSV import task
In order to keep WOCU's Device information complete and up to date, the Only scan active and pending assets field has been added to the CSV_Import task.
More information can be found in the WOCU User Manual.
Networkdevice-traffic-sum Pack
A new pack called networkdevice-traffic-sum has been created to show the sum of traffic carried by a group of interfaces of the same device. The pack is especially useful to obtain the top traffic reports per device instead of per independent interface.
Internal monitoring of platforms
In order to increase the visibility of the monitoring servers, we have extended the installation of the internal Collectd daemon to all the platform components. This will allow us to generate performance graphs of all monitoring equipment automatically.
Improvements in WOCU configuration management
In this version, the way of managing the main WOCU configuration file (/etc/wocu/wocu.yml) has been significantly improved. A new default configuration file (/etc/wocu/default.yml) is now distributed and in the WOCU file it will only be necessary to keep the variables that you want to overwrite.
We hope you find these changes useful and interesting.