
WOCU is ending the year positioning itself as a stable, dynamic, adaptable and powerful tool in this diverse market. This would not have been possible without the uninterrupted work of our entire team and the trust that our clients have in WOCU.
Without a doubt, it has been a different year, but by combining our efforts we have been able to overcome it with each of the developments integrated in the different versions published throughout 2020.
And in case you missed anything, here are the 10 most important features and major developments that we have launched this year.
1. New graph showing the evolution of the areas with the highest number of incidents.
We complete the initial view of infrastructure status surveillance with a graph showing the evolution of the areas with the highest number of incidents recorded in the last 24 hours. It shows the evolution together with the sum of downtime of the assets integrated in standard domains. In addition, it is possible to interact with the graph and see exact data recorded at specific points.
With this integration, we continue to centralize information in the single aggregation console and without having to resort to other external tools.
.png?width=600&name=frame_generic_light%20(1).png)
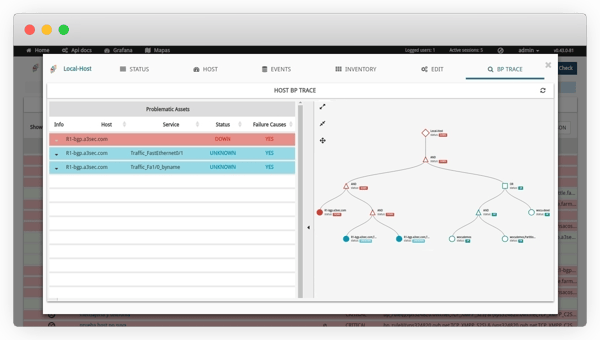
2. Functional and operational upgrade of the Business Process Modeling.
WOCU allows the grouping of hierarchical dependencies of assets in vital Business Processes, which are represented in the BP Trace tab. After several versions, we have achieved a more powerful, functional, clear and accurate view of the correct functioning and availability of the business. Among many other features, we highlight:
-
- Processing and rendering of nested Business Processes, i.e. integration of other Business Processes among their members.
- Locating the root cause of an anomalous monitoring state, specifying the assets causing the total process downtime.
In this way, we have achieved that this space shows a complete overview of the impact that incidents cause in the infrastructure
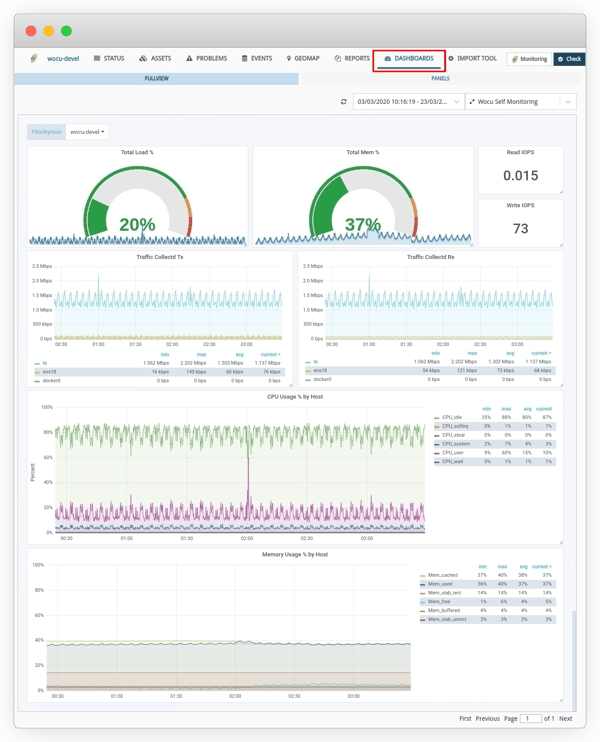
3. Aggregation of external dashboards
Another feature in which WOCU stands out is its ability to integrate third-party applications, avoiding the need to give up the advantages of any existing system in any company.
Therefore, we worked on the integration and visualization of analytical dashboards exported from external tools to WOCU, which can be freely chosen and customized by the operator. The purpose is to export and integrate into the tool health monitoring dashboards of the deployed devices, so that all recorded values can be captured in various widgets, such as bar charts, pie charts, data streams, etc.
We also incorporated the UI-ACL support in the dashboard configuration, allowing the operator to configure the accesses by user type.
4. Complete migration to Python 3
One of the most important milestones of this year and of which we are very proud, has been the complete migration of the WOCU code to Python 3, making WOCU a fully maintainable and long-term project.
The migration includes: backends of the aggregator, the import-tool, the common python-wocu library and the built-in checks used in the monitoring packs.
This culminates in the improvement of our Continuous Integration processes, by incorporating more thorough automatic code reviews and analysis.
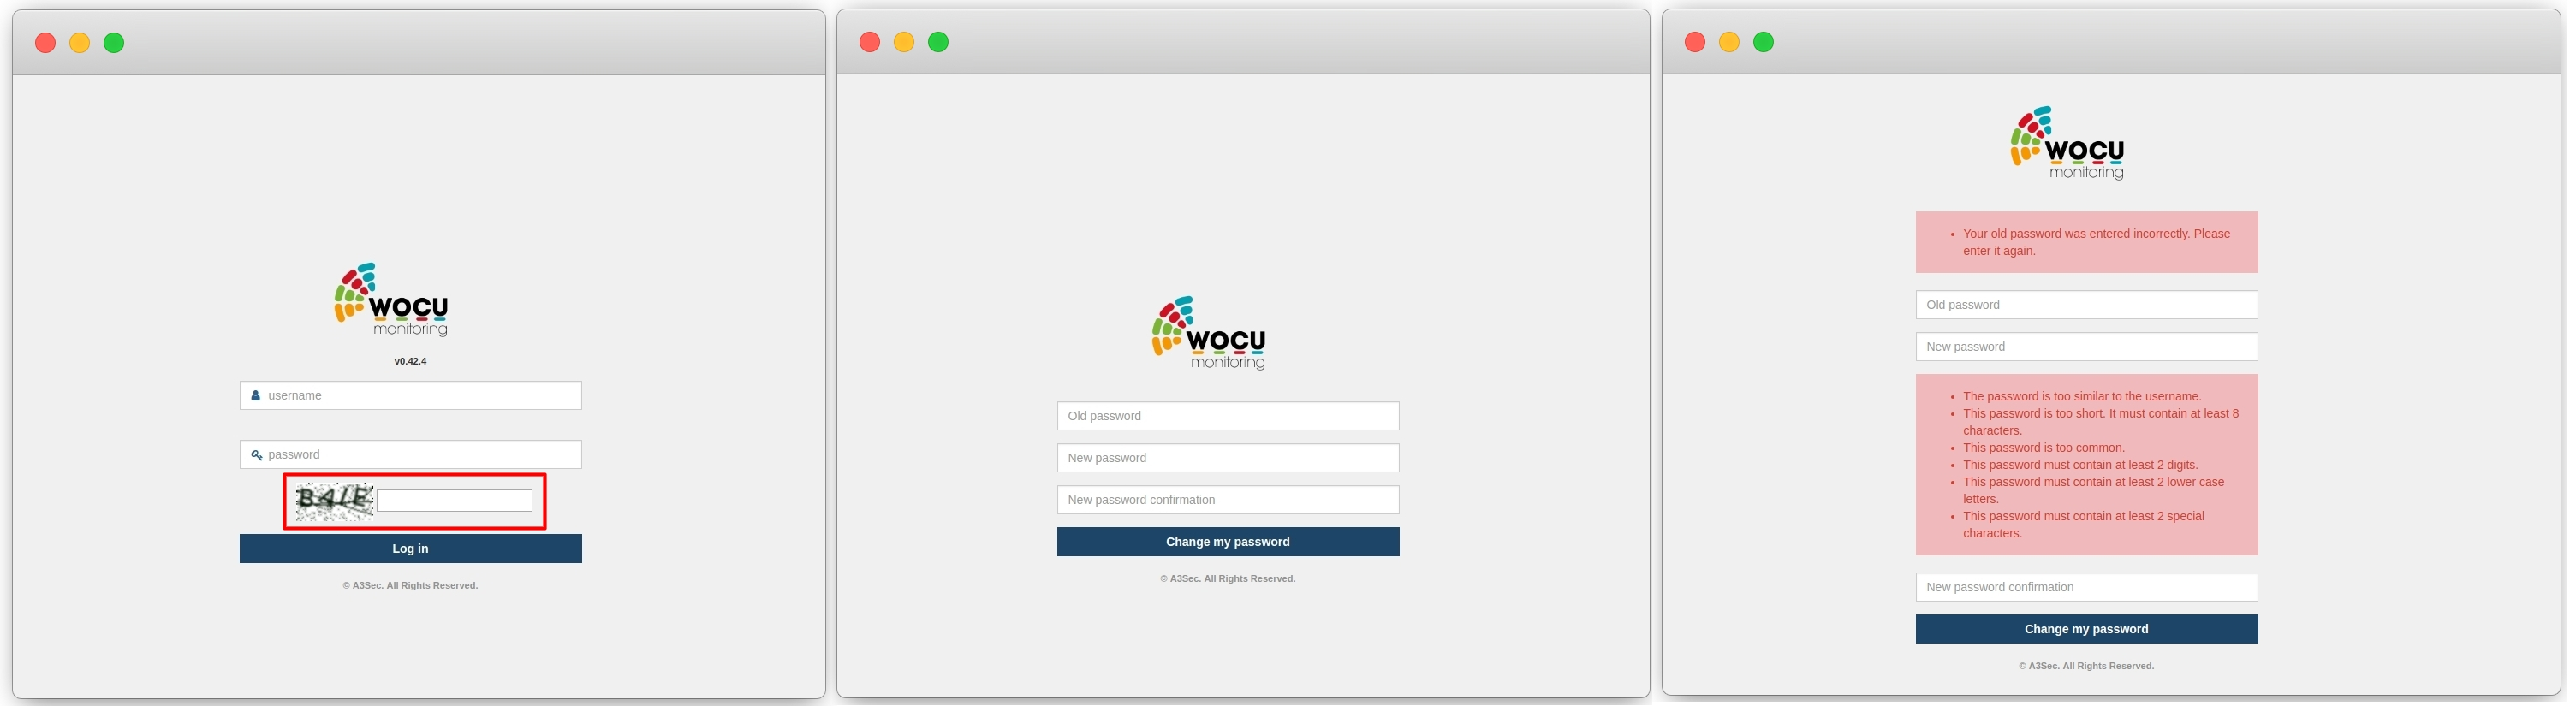
5. New Security Module
Given the growing trend of security threats and attacks, WOCU's priority was to develop a set of preventive protection measures that could address intrusive and unauthorized actions, security flaws or other vulnerabilities that could put our customers' business at risk.
As a result, WOCU ends the year with a powerful additional Security Module, aimed at customers who meet certain security needs and conditions and choose to protect themselves, with a guarantee, from any malicious movements.
Overall, this service combines a set of effective measures, which together with good user education, strong integrated authentication and a strict blocking policy, will mitigate any risk of intrusion and possible malicious activity.
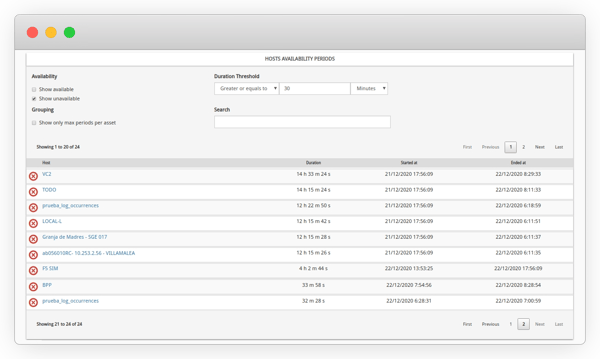
6. New Availability Periods Report (Availability Periods)
Availability is one of the main indicators for measuring the level of performance and operability, as well as being a concept subject to a wide variety of configurations. For all these reasons, and as a complement to other reports, a new Availability Periods Report has been added, aimed at compiling temporary periods of operability of each of the elements that make up the monitored technological infrastructure.
In other words, this report answers questions of the following type:
Which equipment was down for more than 5 consecutive hours last month? How long did my provider take to resolve the incident?
We focus our work so that all useful data collected and provided by the tool is exploited.
7. Independent view of performance data from monitoring metrics
Another of the most useful integrations in terms of distribution and supply of data that are processed and stored by the system is the new Performance view, where all the monitoring metrics are collected together with their performance values, recorded for each service, as a result of the continuous checks in terms of operability towards the network elements.
In general terms, the view includes the monitoring metric data, established measurement thresholds and simple graphs for each metric.
Thanks to the versatility of WOCU and its ability to manage an infinite number of Monitoring Packs, services and metrics of different types, it is possible to generate performance tables that allow a detailed study of the real situation of the network, as well as help to identify problems and performance errors as well as its capacity 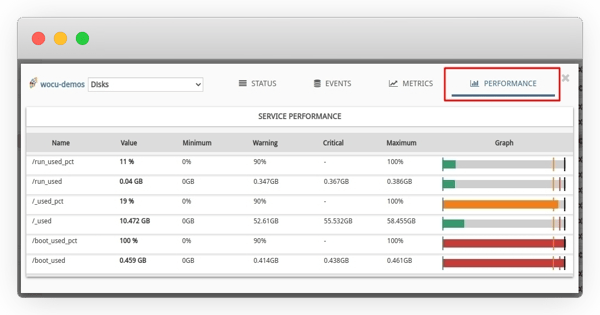
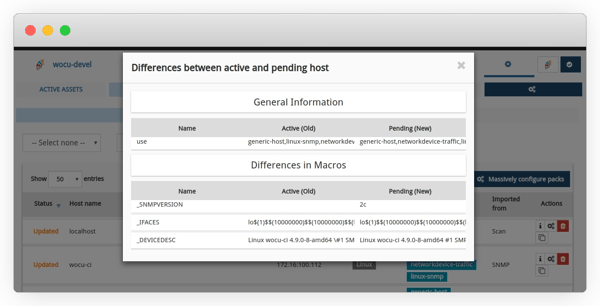
8. Configuration data history after asset updates.
Although this functionality is purely informative, it has become an essential part during the import and auto-discovery of devices, services, interfaces, etc., as a result of the Tasks release.
Thanks to the new individual Differences option, it is possible to know the main differences in terms of configuration and parameterization that a newly discovered asset has undergone and that consequently, it is again housed in the DB of assets pending from monitoring.
This means that the operator can observe the differences between the two versions and decide which configuration profile he is interested in, in order to include it in the monitoring plant.
9. WOCU API documentation has been published.
We have also made public the full WOCU API documentation, including a new separate section in the User Manual itself.
We know the importance of documenting and providing the API, in order to facilitate integration with third parties and to speak the same language.
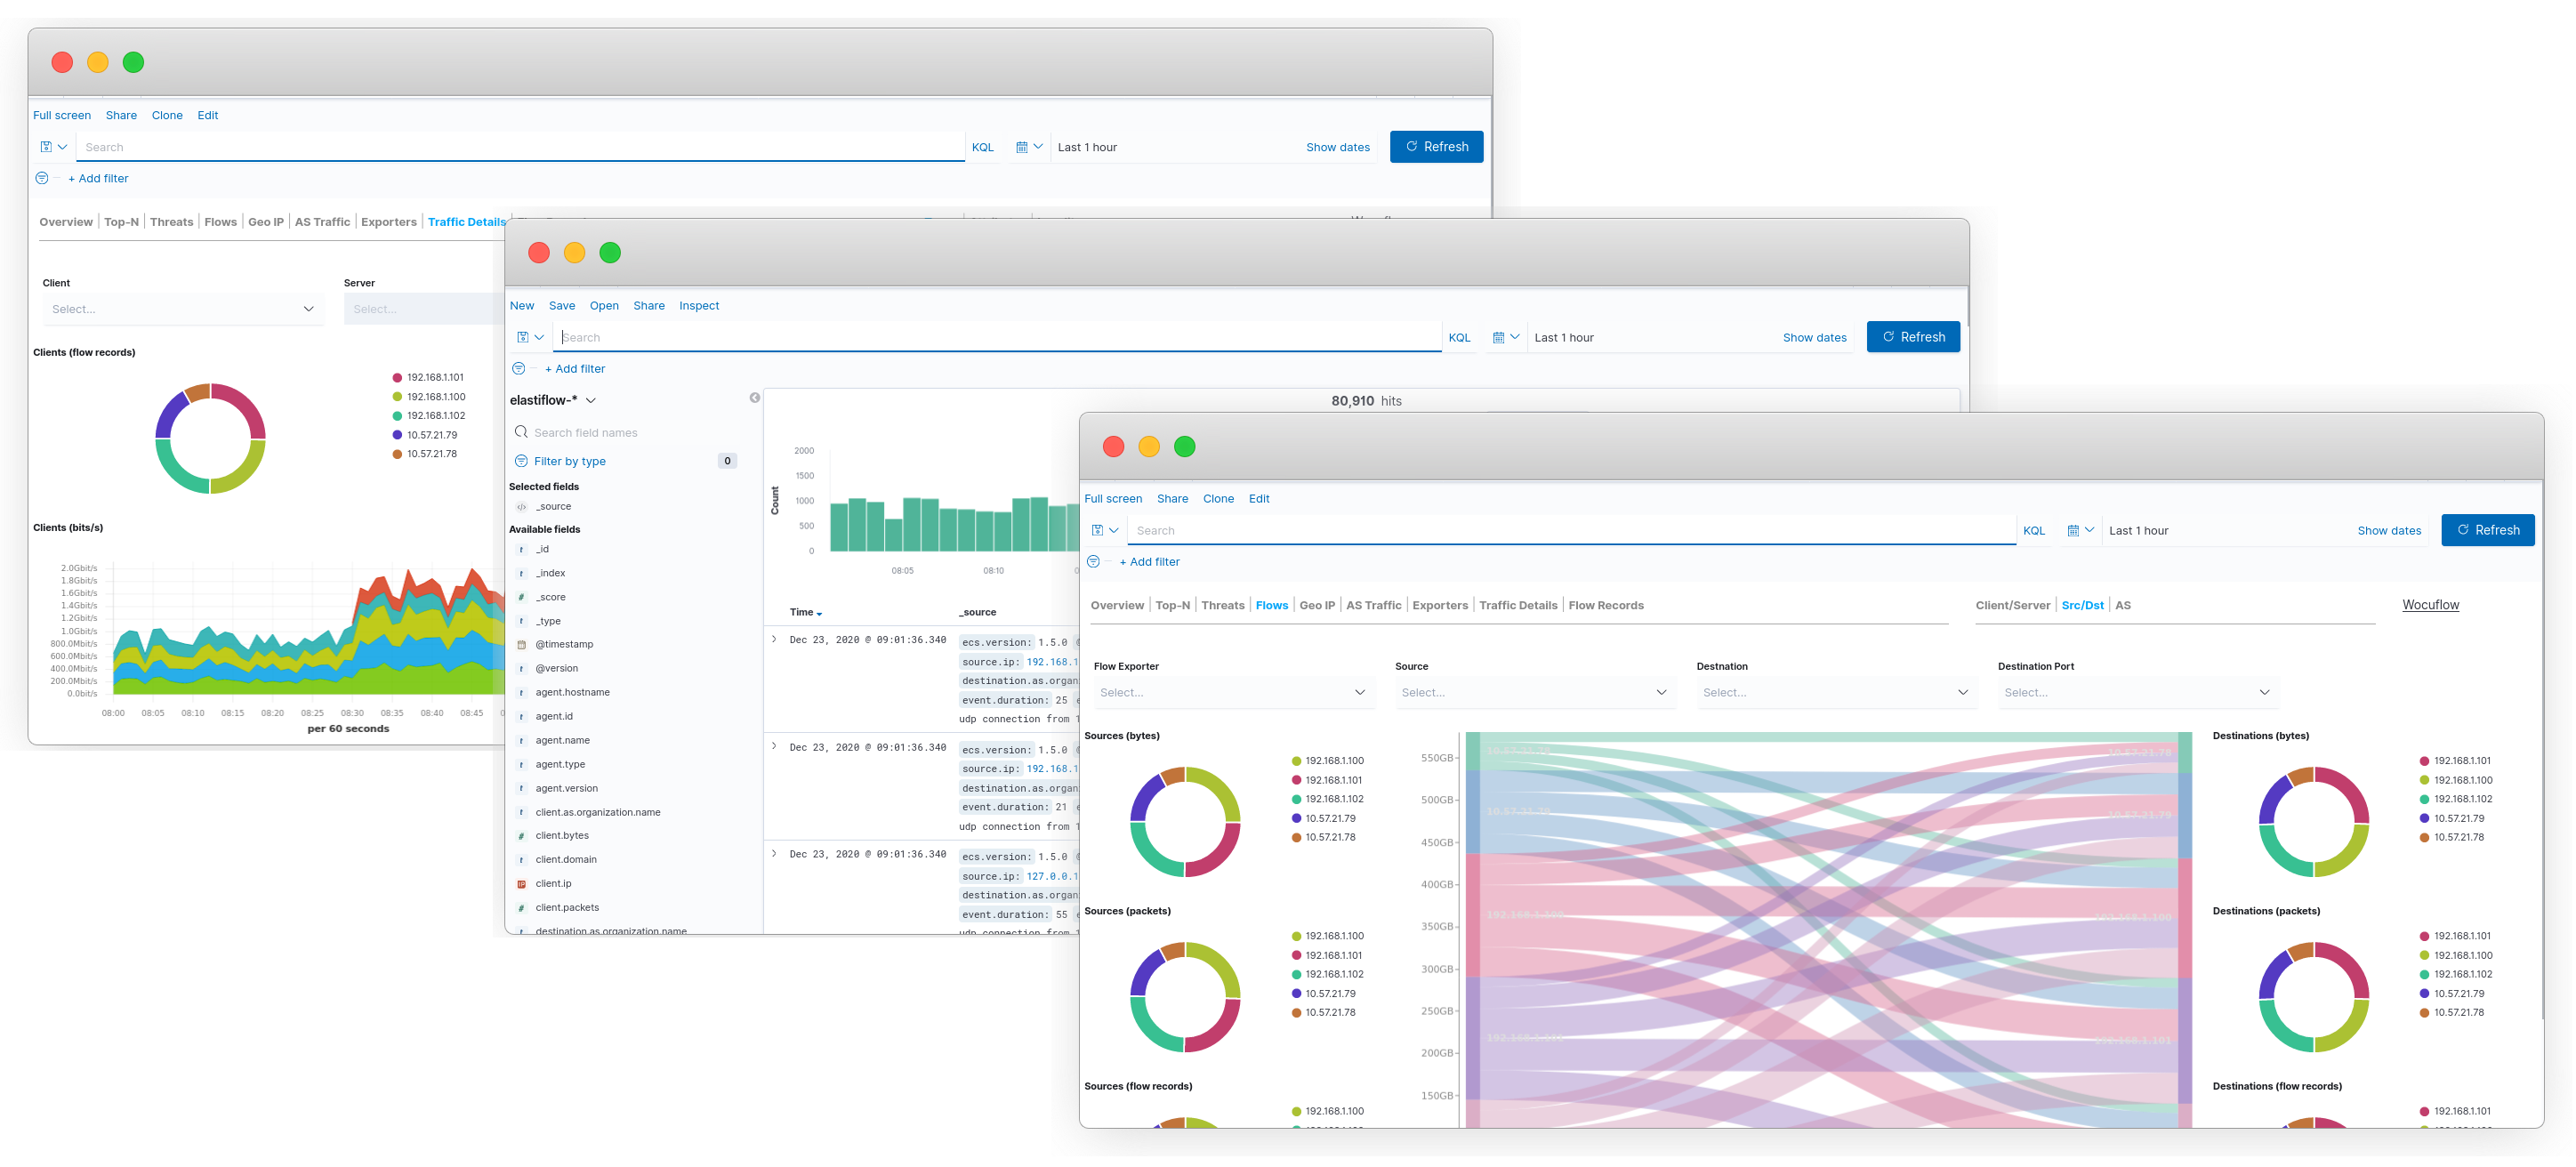
10. New flow analysis and monitoring module: WOCU Flow
And finally, a preview for 2021!
Given the needs of monitoring applications through data flows, WOCU is developing a specific module for netflow monitoring, which will be released during the next year.
This module will be able to capture Netflow (versions 5, 9, ipfix) and Sflow data streams, store them and display them in the WOCU interface. Since it is based on an Open Source software (Elasticsearch, Logstash and Kibana), it will be able to be modified and adapted to each customer's requirements.
WOCU Flow will also provide a tool to manage the flow capture platform, being able to start and stop hot probes, as well as control the bandwidths allowed on each probe.
For 2021: We want to keep climbing the ranks!
You can learn more about WOCU's latest release by clicking here.