The importance of analyzing the events generated by information technologies, as well as the related infrastructures will help us to generate various indicators which can be analyzed according to the business needs of each organization, and even within the same organization these data can be analyzed according to each area. To be able to analyze so much information generated by technologies it is necessary to have specialized tools for data mining. Each project has its own needs and new open source technologies, under license or customized tools are continuously emerging where it is always necessary to have information on how to generate analytics with these new technologies taking advantage of the features that each one offers.
More specifically, Wazuh, being an emerging opensource technology oriented to generate indicators by mining event data, proposes several integrations without any limit, since it is an open source technology, in some cases it requires configurations that are not as clear as those of a licensed technology such as Splunk. Given the scenario, in which the objective is the integration of a technology to this platform through syslog, throughout this document will establish tips and techniques on how to achieve a proper integration without having to go through that stage of frustration at not finding the answers to this problem.
What is Wazuh?
Wazuh is an opensource platform for threat detection, security monitoring, incident response and compliance, with the ability to monitor local servers, cloud services and containers.
Wazuh is an important resource for achieving security compliance.
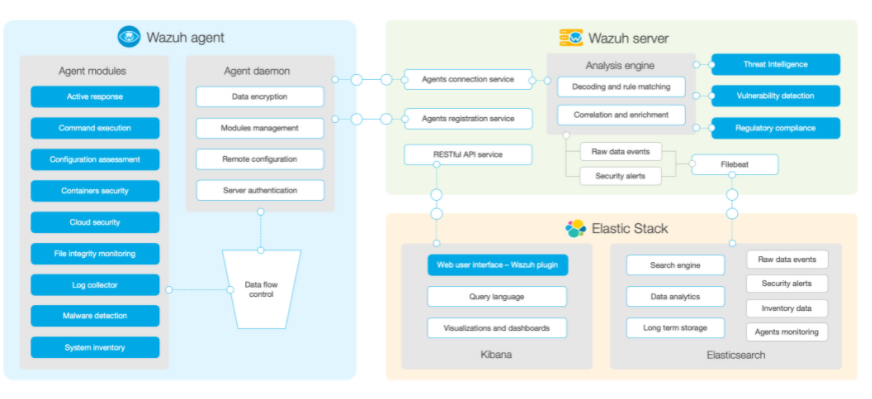
The main components that characterize the wazuh tool are as follows:
- Log collection (log collection).
- Log analysis (log analysis), a set of 3000 HIDS rules can be customized.
- File integrity monitoring (File Integrity Monitoring).
- Host-based anomaly detection.
- Security compliance scanning for know vulnerabilities.
- Real time alerting via e-mail, SMS, Slack to name a few.
- Active response is an IPS implementation powered by HIDS.
Wazuh agents are also available for the following platforms:
- Linux (Debian, CentOS, RedHat, SUSE, Amazon Linux, etc).
- BSD (FreeBSD, OpenBSD and NetBSD)
- Solaris (10 & 11)
- AIX (5.3 or higher)
- MacOS
- Windows
- HP-UX (11v3)
For the download and installation of the latest version of wazuh and related packages please access the following link:
And for questions or documentation please access the following link:
https://documentation.wazuh.com/3.13/index.html
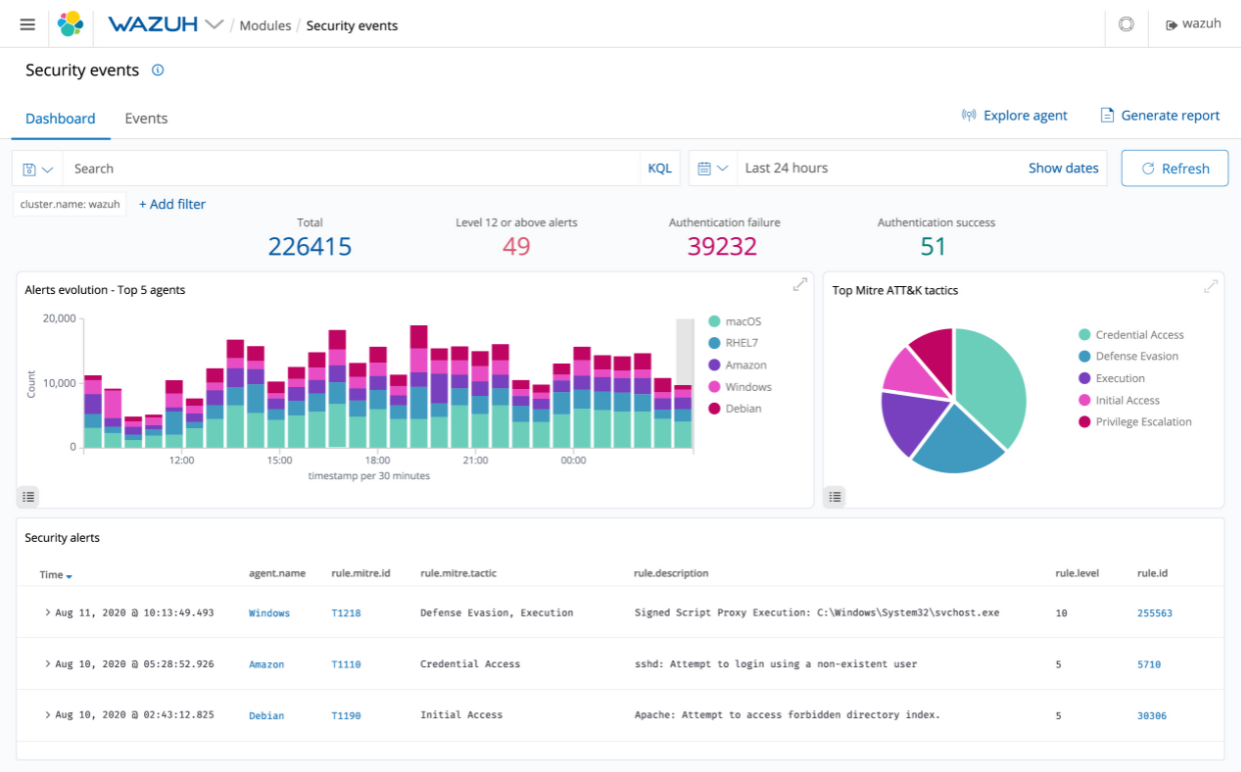
WAZUH WEB INTERFACE
Wazuh Architecture
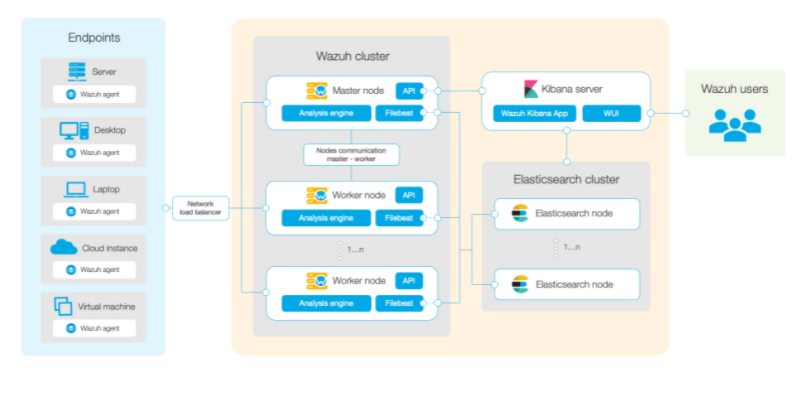
Main components
It is feasible to run the wazuh process in an environment with root or with an unprivileged user depending on the situation.
The service in linux is executed either with systemctl, service or initctl, in the case of windows C:\Program Files (x86)\ossec-agent\win32ui.exe is used.
A diagram of the network communications flow is shown below.
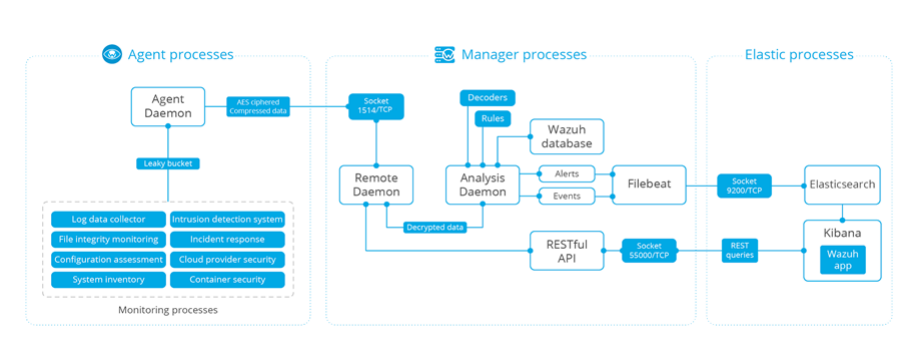
- Agent-Manager connections are compressed and encrypted with pre-shared keys (AES) per agent via tcp or udp 1514.
- Remoted can directly accept TCP and/or UDP port 514 messages from syslog sending devices.
- For more robust centralized syslog collection, syslog servers can be used on agents or administrators.
All Wazuh communications are authenticated and encrypted using AES or TLS encryption.
Wazuh manager worker nodes use TLS to synchronize configuration and status data with the manager master node.
Each agent is assigned its own cryptographic key to report to the manager.
While significant privilege separation and isolation has been created, it is still advisable to further strengthen the Wazuh server, as many other systems will depend on and be influenced by it, especially if remote commands are enabled.
Establishing the connection
The first part that one faces when integrating a new technology into the Wazuh solution is the how?
There are two main options for sending information to the Wazuh solution, the first option is through the installation of an agent that sends events to the Wazuh manager, the second option through the syslog connection to the Wazuh manager, in this case we will expose how to integrate a technology through syslog.
For the integration via syslog to Wazuh the solution is clearly presented in the documentation, so in some cases it is not a problem to perform this configuration which is composed of 5 key tags value as shown below.
https://documentation.wazuh.com/3.8/user-manual/capabilities/log-data-collection/how-it-works.html
<remote>
<connection>syslog</connection>
<port>514</port>
<protocol>udp</protocol>
<allowed-ips>192.168.2.0/24</allowed-ips>
</remote>
Analyzing the events
Wazuh has decoders that are used to identify events and extract critical or important fields from them, Wazuh has a series of default decoders which are efficient for some technologies but in most cases these decoders have their limitations and do not provide the required information when working with events. This results in time spent investigating in vain if there is any work already done, so at the time of making a correct integration it is better to make a custom decoder.
The first thing is to obtain a sample event or events:
Feb 19 14:16:08 ISE-SF CISE_Administrative_and_Operational_Audit 0003835838 1 0 2020-02-19 14:16:08.414 -06:00 0109300897 60134 NOTICE System-Management: DNS Resolution failure, ConfigVersionId=142, AdminInterface=CLI, AdminIPAddress=127.0.0.1, AdminName=system, OperationMessageText=DNS resolution failed for the hostname ISE-SF against the currently configured name servers., AcsInstance=ISE-SF,
Feb 25 09:13:49 ISE-SF CISE_Administrative_and_Operational_Audit 0003867949 1 0 2020-02-25 09:13:49.508 -06:00 0110068270 51002 NOTICE Administrator-Login: Administrator logged off, ConfigVersionId=142, AdminInterface=GUI, AdminIPAddress=xxx.xxx.xxx.xxx, AdminSession=AdminGUI_Session, AdminName=xx, OperationMessageText=User logged out,
The main thing at the moment of analyzing the events is to identify the fields or strings that identify this event from a whole set of events, these strings must identify only and exclusively to this technology, so when identifying this string or field it will be named as parent string or field, this will allow us to generate a parent decoder that will generate all the possible variants which present the events of this technology.
From the previous example the fields Date, Time and name of the technology can be identified as the parent event.
Feb 19 14:16:08 ISE-SF CISE
Once this parent event has been identified, its respective regular expression must be generated taking into account the ossec regular expression syntax.
https://www.ossec.net/docs/syntax/regex.html
When you have the parent regular expression the parent decoder is generated with the following syntax:
<decoder name="ise-decoder">
<prematch>CISE\w\.+\s\d+\s\d+\s\d+\s</prematch>
</decoder>
In the prematch tag is entered the regular expression that identifies the parent event, this tag identifies in a universe of events that only and exclusively meet the criteria established by the regular expression.
After obtaining the parent event you can obtain the fields that are called child events from the parent decoder, these events can be extracted either with a regular expression that extracts all the events or make a field by field extraction.
Field-by-field event extraction.
To efficiently extract field by field it is necessary to have a parent decoder as shown in the document and parse the complete event as shown below:
Feb 19 14:16:08 ISE-SF CISE_Administrative_and_Operational_Audit 0003835838 1 0 2020-02-19 14:16:08.414 -06:00 0109300897 60134 NOTICE System-Management: DNS Resolution failure, ConfigVersionId=142, AdminInterface=CLI, AdminIPAddress=127.0.0.1, AdminName=system, OperationMessageText=DNS resolution failed for the hostname ISE-SF against the currently configured name servers., AcsInstance=ISE-SF,
The first thing to do is to identify some character, number or string that separates the fields, this in order to generate a regular expression that uniquely identifies the field, since in some cases the same field may be in a different position depending on the event delivered by the technology.
In the previous example it is identified that the fields are separated by the sign ( , ) this will help us to generate the following regular expression:
AdminInterface=(\w+),|(\.*)$
The regular expression is composed of the following: the field name (AdminInterface) followed by the sign (=), the field value which in this case is composed of characters (\w) followed by the sign (+) which indicates that there will be one or more characters, the sign that identifies the end of the field (,) , the sign ( | ) generates an "OR" between multiple patterns. the expression "(\w+)" indicates that if the field information does not meet the established criteria of \w+, take any character or not as expressed by the sign (*), this means that the field may have information or not, it also ensures the following with the sign ($) that this field may be the end of the event or be somewhere in it.
The first thing is to obtain a sample event or events:
<decoder name="ise-decoder">
<parent>ise-decoder</parent>
<regex>AdminInterface=(\w+),|(\.*)$</regex>
<order>admininterface</order>
</decoder>
Where parent is the name of the parent event of the technology and order is the name of the field that will be indexed in elasticsearch, displayed in Kibana and in the Wazuh app.
Generating the rules (alerts)
Once the process of event analysis and field extraction is finished, the next step is to generate the rules with the previously extracted fields and events in order to deploy these rules as alerts in the Wazuh App, generating the corresponding indexes by default through Filebeat and thus being able to visualize these alerts through Kibana.
As well as the decoders there are default rules in Wazuh for certain technologies, in this section we specifically consider the case in which you want to use an extracted field and not one generated by default, in order to achieve this goal it is necessary to use the following key value format within the generated rules file:
<field name="nombre del campo">Valor del campo</field>
It is important to give the exact name of the field between the symbols (" ") so that the rule recognizes by means of the decoder the field with which it will work, after entering the name of the field, the value of the field is entered, which can generate the alert or establish a parent condition from which to derive several alerts.
<rule id="100010" level="4">
<if_sid>1000000</if_sid>
<field name="administrator_login">Administrator authentication failed</field>
<description>Login Fail - ISE</description>
</rule>
*Note that custom rules must have a rule id > 100,000 as a lower number is reserved by Wazuh's default rules and this could cause conflicts between the default and custom rules.
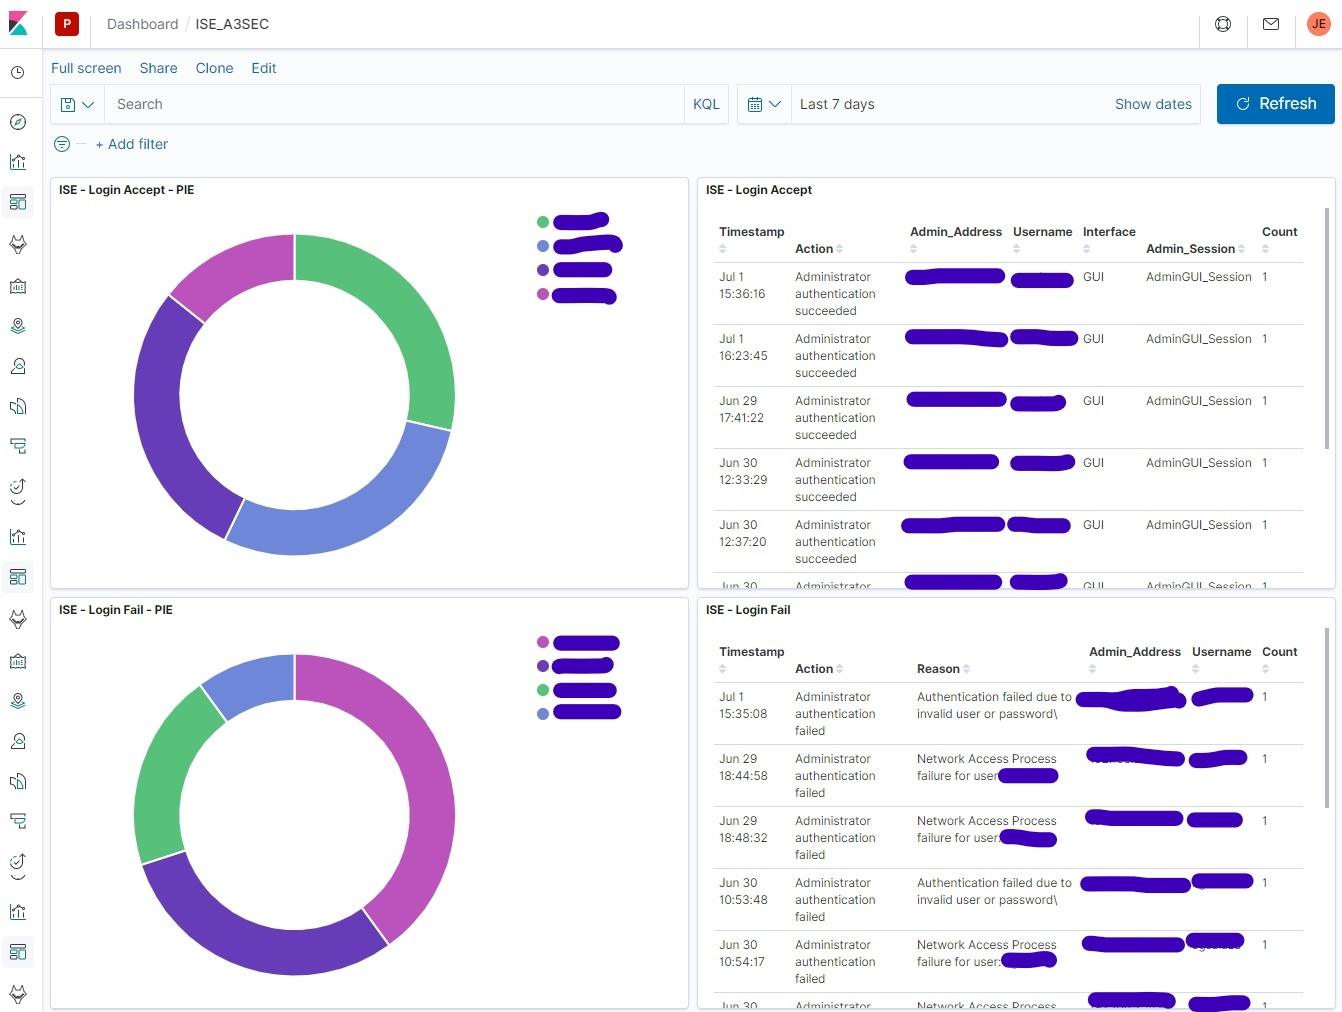
Painting the alerts on the Dashboard
The dashboard will be the final product of an efficient integration, as it is the conclusion of event analysis, field extraction and creation of rules that derive alerts.
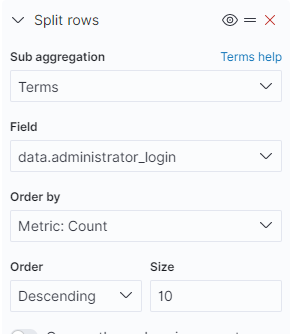
In Kibana, dashboards are made up of one or several panels, so the first step is to generate the panels that make up the dashboard.
To generate a dashboard it is enough to have the idea of what is going to be presented in it.
In the following example a dashboard is generated based on the id of the generated rule and the agent's IP, in both cases the filters can be generated both in the Query and Filter part.
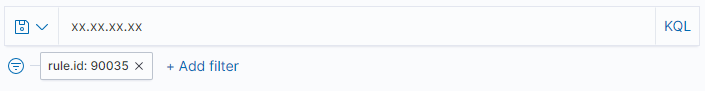
The upper part where the IP is located corresponds to the Queries field and the lower part where the rule id is displayed corresponds to the Filter section.
*Note: The syntax varies with respect to the Queries and Filter fields.
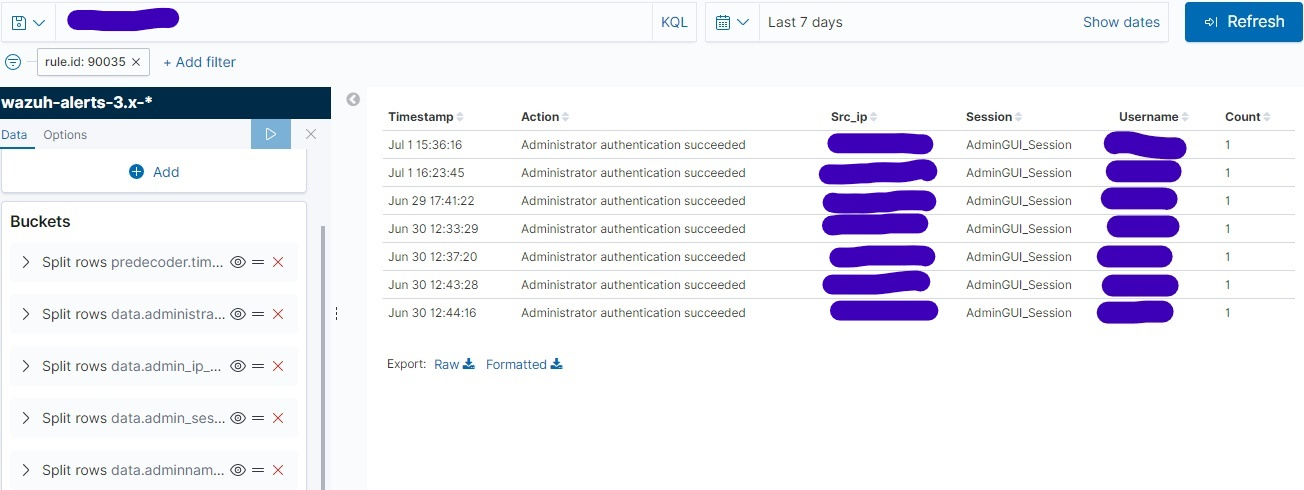
Once the necessary filters have been generated to specify the search and reduce search times, the alert information is displayed based on the fields contained in the alert.
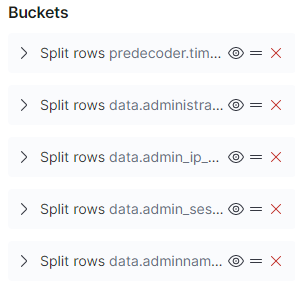
Once the fields have been extracted, the information is displayed in the panel and it is entered in the dashboard to finalize the integration process from zero to dashboard exposed in the blog.
Conclusion
This blog showed in detail how to integrate a technology through syslog to Wazuh, from the configuration of the Wazuh environment to receive events through syslog, the analysis of the events received to extract the critical fields and form a parent field, to obtain events that identify each technology, with the generated fields rules were formed by the extracted fields to present these alerts through panels that make up the dashboard to display.
With these steps is done a proper integration of any type of technology to Wazuh by providing tips in order to achieve this integration effectively and without the need to invest time in documentation that is not easily available.